Skip to content

Braveterry

My informations: Let me show you them

  • About

Recent Posts

  • Pushbullet: Move information among your devices
  • Vault: Tool for Secure Secret Storage written in Go
  • Link: Building a Shop with Sub-Second Page Loads: Lessons Learned
  • Link: I Miss Being Part Of A Complete Team
  • The Jupyter Notebook: Web app for creating and sharing docs with live code, equations, visualizations & explanatory text.

Tags

  • api
  • books
  • browser
  • cms
  • command-line
  • css
  • database
  • dependency-management
  • documentation
  • framework
  • git
  • go
  • html
  • java
  • javascript
  • json
  • library
  • markdown
  • messaging
  • micro-services
  • mobile
  • node.js
  • opensource
  • operations
  • performance
  • perl
  • php
  • podcast
  • programming language
  • python
  • rest
  • ruby
  • scm
  • search
  • security
  • services
  • software
  • Software Development
  • static-site-generation
  • testing
  • tutorial
  • unix
  • visualization
  • webserver
  • windows

Archives

  • November 2016
  • September 2016
  • August 2016
  • July 2016
  • June 2016
  • May 2016
  • April 2016
  • March 2016
  • February 2016
  • January 2016
  • December 2015
  • November 2015
  • October 2015
  • September 2015
  • August 2015
  • July 2015
  • June 2015
  • May 2015
  • April 2015
  • March 2015
  • February 2015
  • January 2015
  • December 2014
  • November 2014
  • October 2014
  • September 2014
  • August 2014
  • July 2014
  • June 2014
  • May 2014
  • April 2014
  • March 2014
  • February 2014
  • January 2014
  • December 2013
  • April 2013
  • March 2013
  • February 2013
  • January 2013
  • December 2012

Tag: visualization

FnordMetric: Write SQL queries that return SVG charts rather than tables

FnordMetric screenshot

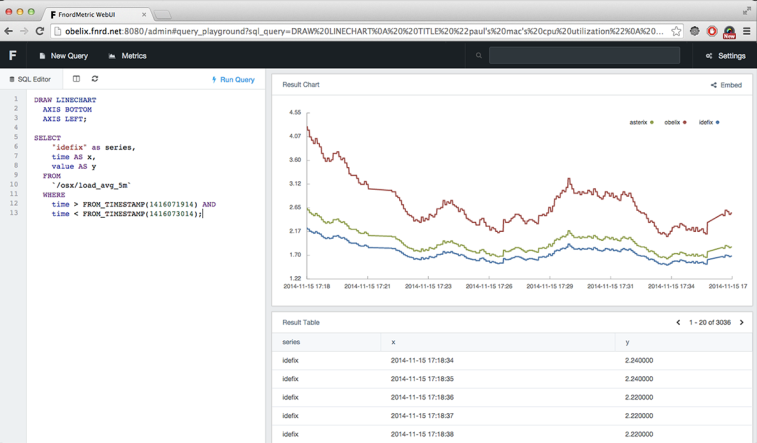
http://fnordmetric.io/chartsql/


Compare to StatsD + Graphite

Posted on November 24, 2014November 23, 2014Tags analytics, c++, sql, visualization

Graphite: Scalable Real-Time Graphing system written in Python

Graphite screenshot

http://graphite.wikidot.com/

Posted on November 13, 2014November 9, 2014Tags python, visualization

Link: Useful Unix commands for exploring data

Terminal screenshot

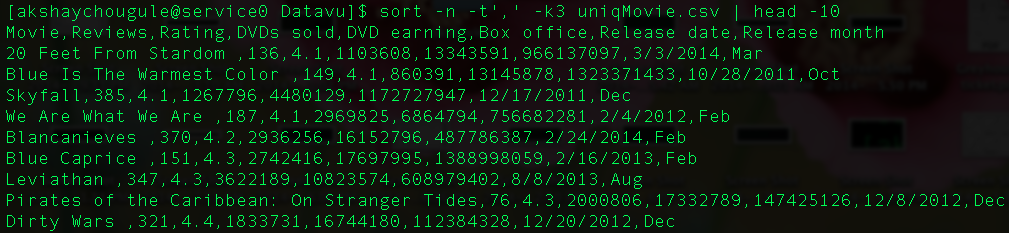
http://datavu.blogspot.com/2014/08/useful-unix-commands-for-exploring-data.html ᔥ


Make sure to check out the comments for more useful commands and techniques.

Posted on October 29, 2014October 29, 2014Tags command-line, unix, visualization

vis.js: Browser based Javascript visualization library

vis.js logo

From the vis.js website (via):

Vis.js is a dynamic, browser based visualization library. The library is designed to be easy to use,
to handle large amounts of dynamic data, and to enable manipulation of and interaction with the data.
The library consists of the components DataSet, Timeline, and Graph.

Posted on April 25, 2014April 19, 2014Tags javascript, library, visualization

Posts navigation

Previous page Page 1 Page 2
Proudly powered by WordPress
 

Loading Comments...