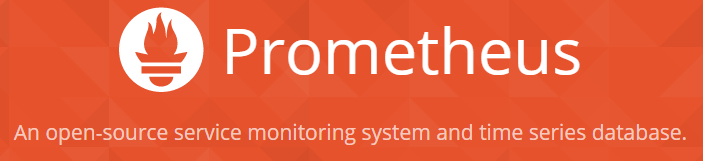
http://prometheus.io/
From the Prometheus website:
- Data model – Time series identified by metric name and a set of key-value pairs.
- Query language – Allows slicing and dicing of collected time series data in order to generate ad-hoc graphs, tables, and alerts.
- Visualization – Built-in expression browser, a GUI-based dashboard builder, and a console template language.
- Storage – Stores time series in memory and on local disk in an efficient custom format. Scaling is achieved by functional sharding and federation.
- Operation – Each server is independent for reliability, relying only on local storage. Written in Go, all binaries are statically linked and easy to deploy.
- Client libraries – Client libraries allow easy instrumentation of services. Currently, Go, Java, and Ruby are supported. Custom libraries are easy to implement.
- Alerting – Alerts are defined based on Prometheus’s flexible query language and maintain dimensional information. An alertmanager handles notifications and silencing.
- Exporters – Existing exporters allow bridging of third-party data into Prometheus. Examples: system statistics, as well as Docker, HAProxy, StatsD, and JMX metrics.