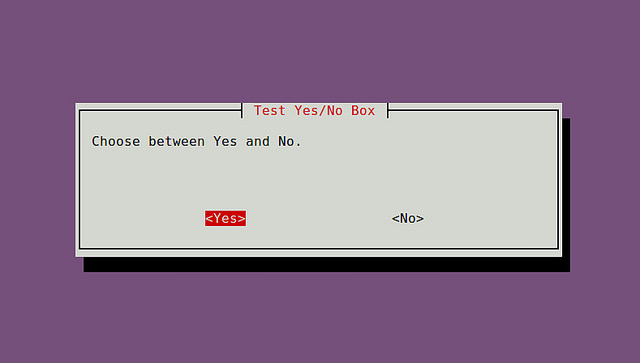
Tutorial here: http://xmodulo.com/create-dialog-boxes-interactive-shell-script.html
Whiptail Man page here: http://linux.die.net/man/1/whiptail ᔥ
Tutorial here: http://xmodulo.com/create-dialog-boxes-interactive-shell-script.html
Whiptail Man page here: http://linux.die.net/man/1/whiptail ᔥ

Some good stuff in this podcast.
[
From the Swagger 2.0 Github page:
The goal of Swagger™ is to define a standard, language-agnostic interface to REST APIs which allows both humans and computers to discover and understand the capabilities of the service without access to source code, documentation, or through network traffic inspection. When properly defined via Swagger, a consumer can understand and interact with the remote service with a minimal amount of implementation logic. Similar to what interfaces have done for lower-level programming, Swagger removes the guesswork in calling the service.
Use cases for machine-readable API interfaces include interactive documentation, code generation for documentation, client, and server, as well as automated test cases. Swagger-enabled APIs expose JSON files that correctly adhere to the Swagger Specification, documented in this repository. These files can either be produced and served statically, or be generated dynamically from your application.
Without going into a long history of interfaces to Web Services, this is not the first attempt to do so. We can learn from CORBA, WSDL and WADL. These specifications had good intentions but were limited by proprietary vendor-specific implementations, being bound to a specific programming language, and goals which were too open-ended. In the end, they failed to gain traction.
Swagger does not require you to rewrite your existing API. It does not require binding any software to a service–the service being described may not even be yours. It does, however, require the capabilities of the service be described in the structure of the Swagger Specification. Not all services can be described by Swagger–this specification is not intended to cover every possible use-case of a REST-ful API. Swagger does not define a specific development process such as design-first or code-first. It does facilitate either technique by establishing clear interactions with a REST API.

http://usergrid.incubator.apache.org/
Learned about this at one of the sessions at the DevNexus software developer conference in Atlanta. It has built-in support for:
According to the Require.js website, it’s compatible with
Currently supports CSS, Golang(lint and vet), Javascript, Java, Shell, Scala, JSX, CPP, C++, Dart, Ruby, Python, CMake and PHP.